

Many investors are familiar with the “January effect,” which is the tendency of the stock market to perform well at the start of the year.
Well, there’s a new “January effect.” The best performing month is now actually December.
Also, there’s a less well-known “September effect” and it has nothing to do with the colors of autumn.
Turns out, September is a terrible month for stocks.

Tough Month
Will September of 2015 conform to a history of disappointment?
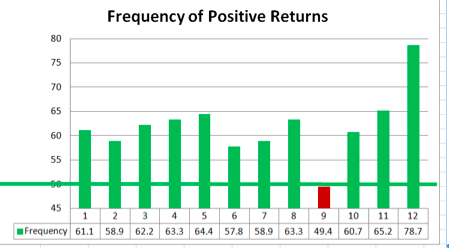
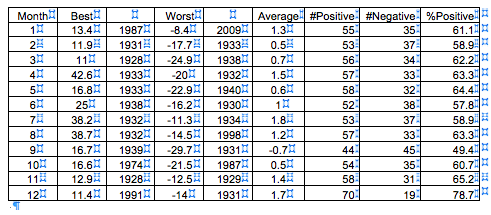
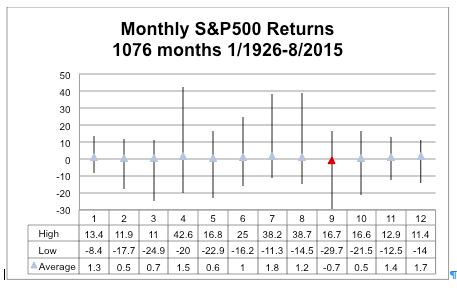
As shown in the table and graphs below, the month of September stands out as being the most likely to disappoint.
Losses Galore
Here are some observations
September’s 0.7% average loss is not only the lowest return; it’s the only month with a negative average return.
Unlike the other 11 months, September is as likely to produce a negative return as it is to produce a positive return. September earns positive returns about half the time. All of the other months have a history of positive returns 60% or more of the time.
September’s worst return – losing 29.7% in 1931—is the worst of the worst. Some think October is the worst month because they remember the 21.5% loss in 1987, but this was not the worst month ever.
September’s best return – earning 16.7% in 1939 – is far below the average of the best returns, at 21.3%, although it is median.
Vacation’s Over
So why is September such a nasty month?
I think it’s due to the fact that investors are done with their vacations, so they’re back at their desks trading, and mucking things up.
Maybe they’re just plain ornery coming back to work, but it’s more likely that they simply increase volatility.
Volatility
In his 1999 book, The Beast on Wall Street, Dr Robert Haugen documents the fact that market volatility is mostly driven by investor behavior.
Specifically he shows that there is only a weak connection between major events and market swings.
Little has happened historically on the days of big market swings, and the market response has been ho-hum on big event days.
Tax Loss Harvesting
A related explanation is that investors start their tax loss harvesting in September, to get ahead of the end-of-year crowd.
This would represent the flip side of the “January effect” which is caused by investors buying back the stocks they sold for tax purposes.
Jolly December
It would also explain why December has replaced January as the best performing month.
Note that December has produced positive returns 78.7% of the time; that’s worth betting on.
If my explanation is correct, this September is likely to disappoint because investors will be back at their trading desks, but history tells us that it is a coin-flip probability – worse than the other 11 months but not all that predictable.
Photo Credit: Randi Hausken via Flickr Creative Commons


