U.S. stock prices have displayed a distinct trading pattern in the last two years. Since the beginning of 2013, the S&P 500 Index has found support after low-volatility sell-offs at its 100-day moving average (100 DMA).
This line of support has been acting as a springboard for sharp moves higher as a result of short covering by various market participants, who were expecting a deeper correction.

This pattern has occurred seven times during this recent low volatility period. Now, the stock market rally is looking a little parched.
Changing winds
To be honest, we found ourselves on the short side as well in some of these situations, which is one of the reasons why the Technical Swing portfolio underperformed during the last year.
The question is how long will the 100 DMA pattern keep on working. There are reasons to believe that the environment has changed and the support line could fail.
One reason to be cautious is the fact that the pattern has become too obvious for everybody. Markets have a tendency to surprise the maximum number of people.
It is a law of market efficiency that obvious patterns have to defeat themselves once everybody tries to trade them.
It is impossible to predict when patterns stop to work. However, markets are probabilistic, so the chance that the S&P 500 will not find support at the 100 DMA is decreasing over time.
Another way to evaluate patterns is to simply try to find out if the market environment has changed by analyzing intermarket relationships.
Throttle back
If the environment changes, it might make sense to be less aggressive. Chart 1 shows the S&P 500, the US Dollar Index ETF (UUP) and (EZU), a European stocks ETF for the last two years.
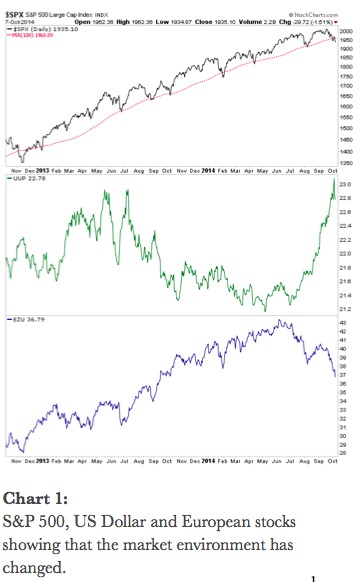
Almost the entire period can be characterized by an environment, where the U.S. dollar was declining and European stocks moved in sync with US equity markets.
But something changed in the last months: in July, the Greenback started to rise shapely and Europe went into a deeper correction, thus decoupling from American stocks.
We don’t care, why the environment is different. The fact that it has changed tells us to be careful with patterns that worked in the past.
In addition, US stocks have been flashing a big warning sign for over a year: fewer and fewer stocks have been participating in the rally.
Chart 2 shows the number of S&P 500 stocks at new 52 week highs. As one can see, the rally was a healthy one until the mid of 2013.
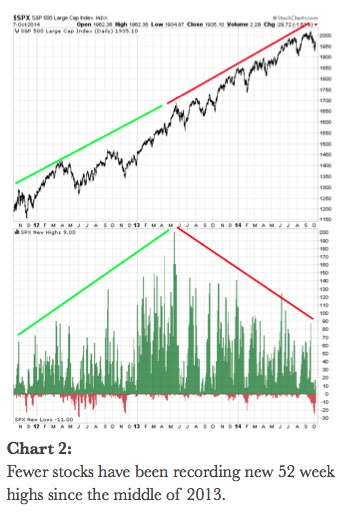
But since then, the number of participating stocks has been declining. We wrote about this phenomenon in earlier reports. It is impossible to exactly time the market using this indicator.
Yet, historically, major market tops have been preceded by fewer participating stocks.
So what does this all mean? Unless new bullish signs emerge, this is not the time to load up on equities. Markets are currently oversold, so sharp rallies could happen any days.
Chances are they will be short-lived in my opinion.
—
DISCLAIMER: The reader should not assume that any investments identified were or will be profitable or that any investment recommendations or investment decisions we make in the future will be profitable. Past performance is no guarantee of future results.