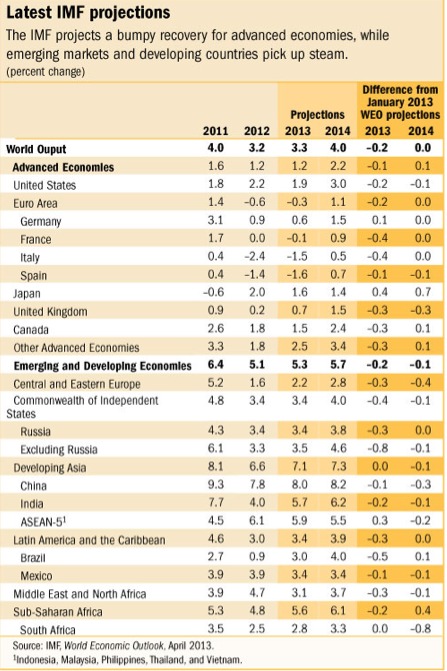
As we head into the second quarter, there is a great divergence in economic performance between the advanced economies and emerging markets. That’s clear from the International Monetary Fund’s recent revisions to its 2013 World Economic Outlook released on April 16.
Overall, the IMF trimmed its global growth forecast to 3.3% (from 3.5% in January) with emerging economies leading the way at 5.3%. Rich world countries (the U.S., Europe and Japan) should perform much slower according to the IMF – only 1.2%. The big disappointment is the Euro Area, which the IMF sees contracting 0.3%. The U.S. is seen growing at 1.9%. And the IMF sees short-term risks in both the U.S. and the Euro Area:
The WEO observes that recent policy actions in Europe and the United States have improved the short-term risk picture although dangers are still present. In the euro area, the recovery could be slower than expected because of adjustment fatigue, weak balance sheets, broken credit channels in the periphery, and insufficient progress toward stronger economic and monetary union. In the United States, larger-than-expected fiscal adjustment from automatic spending cuts (the so-called budget sequester) or failure to raise the debt ceiling could exert a stronger drag on growth.
Another interesting trend showcased by the IMF: In past recessions dating back to the mid-1970s, the advanced economies have recovered faster than developing ones. Now, in the aftermath of Great Recession, it is the emerging economies leading the way. Take a look at this chart that maps average growth after previous downturns.
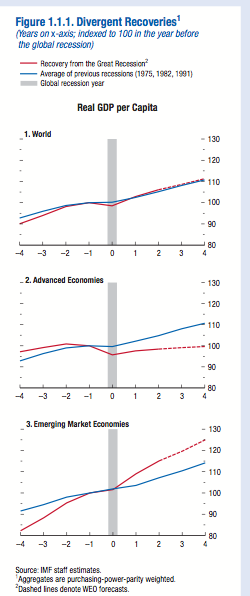
The so-called BRICS (Brazil, Russia, India, China and South Africa) have been responsible for 55% of global growth since the end of 2009, the Economist points out. “Dragged down by debt and austerity, the 23 countries that make up the developed world contributed just 20% to that growth,” the magazine notes.

That said, emerging market stock prices have lagged behind the performance of the S&P 500 Index (SPX) so far in 2013, as reflected in the next chart.

Photo Credit: wili_hybrid