The second quarter of 2015 ended with a bang.
Greece was a highlight that ended up wiping out most equity market gains for the year, and underlying the fragility of this extended bull market.
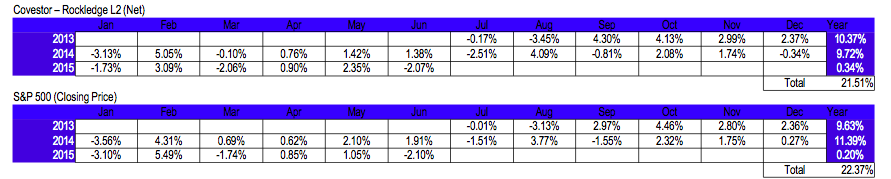
The Rockledge L2 Portfolio has gained 0.34% since the start of the year after fees and expenses.
Performance
This compares favorably against the S&P 500, the benchmark index. The S&P 500 index gained 0.20% for the same period when calculated on closing prices.
Since inception, July 2013, the Rockledge L2 strategy has gained 21.51%, net of fees, versus the S&P 500 index which gained a similar 22.37%, again, as measured using closing prices.
Mid-course Adjustments
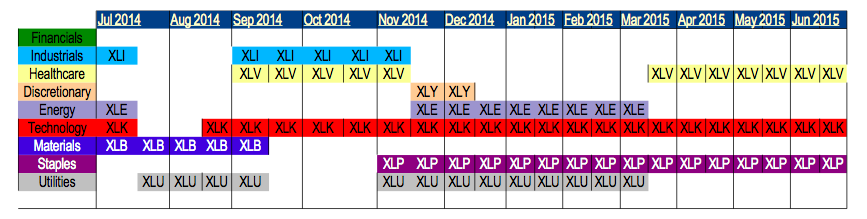
Rockledge made adjustments regarding its lineup of SPDR Select Sector ETFs during the course of this year, eliminating its holdings in energy (XLE) and utilities (XLU) and adding healthcare (XLV).
Overall, the portfolio ended the half with equal weighted holdings to consumer staples (XLP), healthcare (XLV) and to technology (XLK).
Healthcare stocks (XLV) have gained 8.8% thus far this year, leading all sectors.
Rockledge has held XLV through much of the year, which has contributed well to performance.
Energy Market
Energy stocks have had a very volatile time since the crash of oil prices late last summer.
XLE has traded up one month to just lose the same the next, with little clarity on fundamentals and technicals.
Utility stocks were also impacted by the oil price fall, and have been difficult to value. ETF prices for XLE and XLU have been linked more to sentiment, and oil supply and demand rather than historical drivers.
We exited these positions; but, got caught on the way out, attributing to modest losses to the portfolio.
The remaining holdings have been mixed, with no meaningful contributions.
Holdings in technology gained some, (+0.12%) while consumer staples (XLP) fell slightly (-1.8%).
Strategy
Rockledge deploys a mix of fundamental analysis, macro analysis and technical analysis to determine its sector forecasts.
We utilize data such as earnings and revenues to establish a fundamental picture.
We overlay a macro picture by examining such things as how interest rate changes may impact sector prices.
Technical Analysis
Finally, we look carefully at technicals, such as the rate of change in a sector’s price and moving average.
From a technical standpoint, the S&P slid to 734 in 2009 and was trading at 2134 just last month. This represents over 190% increase, not including dividends.
This bull market seems to have outlasted even the most optimistic of forecasts, and in fact, has returned 100% over the past 5 years, well above the historical 8% annualized return since 2005.
June witnessed a very interesting mark when the S&P 500 fell below its 200-day trailing average. Technical analysts will be carefully watching how the markets jump back.
Support Levels
There appears to be good support at the 2050 level. There is also good resistance at the 2130 level. A bull market will need to pierce those levels quickly.
On the earnings front, US revenues and earnings are slowing.
FactSet reports YoY earnings growth, 12 months out, declining approximately 5%.
Energy is expected to lead, with disappointing earnings off 20-30% from this time last year. Quick mathematics, given this single forecast, suggests a decline in the markets.
Fed Policy
From a macro point of view, interest rates are beginning to point upward. After much anticipation, it would appear that the current low rate environment, which has been so beneficial for stocks, is over.
Interest rates will increase, and while it’s likely that it will not be a brisk rise, it is a rise which will be a weight on the markets.
Greek Drama
Greece has been another recent factor. The issues in Greece highlight how global uncertainty can lead back to the markets at home.
Difficult to anticipate, the issues of Greece led to a 2% market loss at the end of the quarter. These events seem to me to leave as quickly as they come.
As an example, most investors have already forgotten that in October last year, the S&P fell close to 10% mid-month.
By month end, everything had returned to normal, recovering the losses. It was a blip in hindsight, but, like with Greece, a scary time at the time.
Markets have gotten used to these events. Events lead to intervention. Intervention comes in different shapes and sizes – they can be seen as a new financial package, maybe a new accounting rule or perhaps a war.
From a macro view, there are many potentially bad events on the horizon.
Outlook
Given this less optimistic assessment of risk, technical analysis, earnings outlook and the macro backdrop, Rockledge will likely remain in its current positioning, holding XLK, XLV and XLP, at least through summer.
Healthcare and staples have historically been considered to be defensive positions. The theory goes that in bad times, people still buy razors and food and go to the doctor.
Furthermore, the earnings outlook on these sectors is far better than the rest. Technology, too, seems to be in a sweet spot.
The overall economy has been improving and the need for speed continues to grow with it.
Globally, the trend for more mobile services is growing as well, good signs for technology.
Photo Credit: Walter Rodriguez via Flickr Creative Commons
The investments discussed are held in client accounts as of July 6, 2015. These investments may or may not be currently held in client accounts. The reader should not assume that any investments identified were or will be profitable or that any investment recommendations or investment decisions we make in the future will be profitable.