

The U.S. stock market continued to power ahead in July and the Dow Jones Industrial Average (INDU) and S&P 500 Index (SPX) are up about 18% each for the year. It’s an opportune time to size up the equities market, so here are five charts that tell the story.
In July, concerns over when the U.S. Federal Reserve Bank might start winding back its $85 billion in monthly bond purchases continued to be debated by global investors, though that hardly had a negative impact on stocks. The S&P finished up just over 5% for the month:
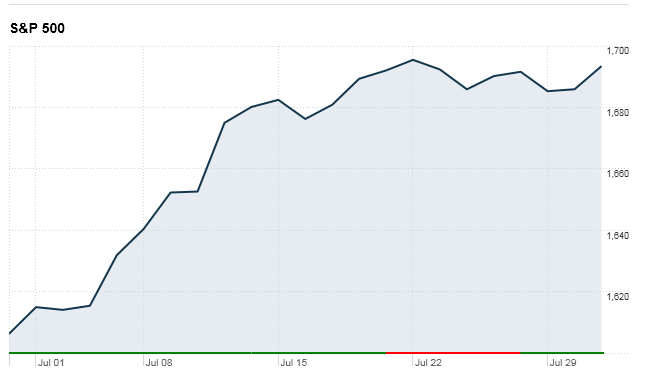
On July 31, the Fed announced that it would leave its bond-buying program unchanged to “support a stronger economic recovery.” Some analysts such as Caroline Baum with Bloomberg View now think the Fed won’t act until after September, which had been the consensus view of when Fed tapering would begin.
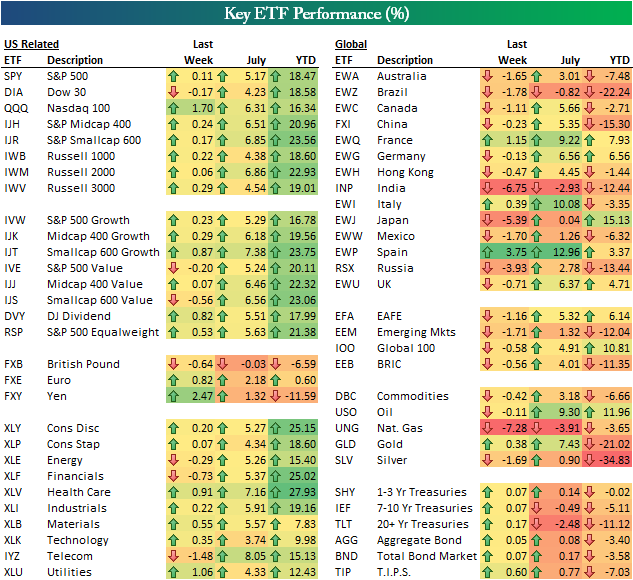
Bespoke Investment Group posted an ETF sector scorecard that reveals some interesting trends. Winners: Telecom (IYZ) and Health Care (XLV) saw the biggest gains in July; for the year, Financials (XLF) and Consumer Discretionary (XLY) are up the most at more than 25%.
As for regions, Europe and Japan are doing well, while emerging markets India (INP) and Brazil (EWZ) are getting crushed – click to enlarge:
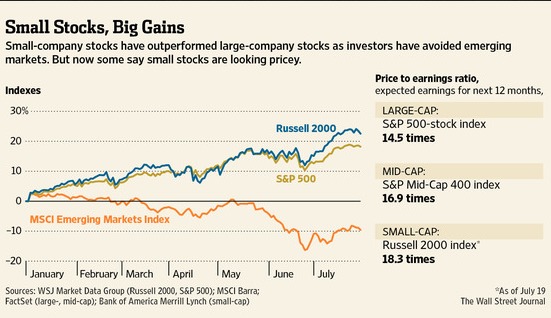
Meanwhile, while small-cap stocks have been on fire for most of the year, they are starting to get pricey. As this WSJ chart shows, small cap stocks in the Russell 2000 Index (RUT) are trading at 18.3 forward earnings over the next 12 months, vs. 14.5 times for S&P 500 stocks.
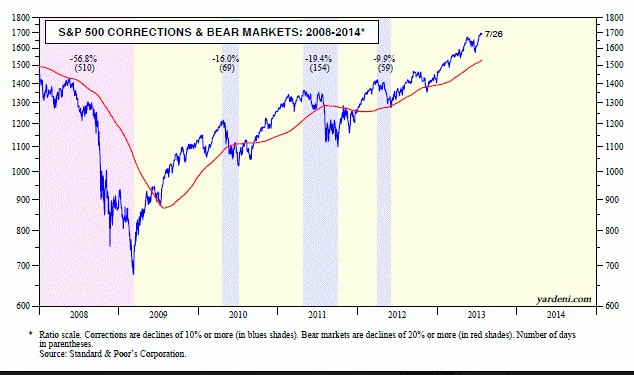
Looking at the bull market that started in March of 2009 more broadly, market strategist and economist Ed Yardeni finds reason for optimism. He posted an illuminating chart mapping up the current expansion that has seen some disturbing corrections in recent years. However, this year the market has stormed ahead pretty much unchallenged.
There has been only one mini-correction, with the S&P 500 down 5.8% from May 21 through June 24. Fears that the current bull market (2009-?) might be tracking the previous one (2003-2007) have abated as stock prices rose to new record highs this year, surpassing the previous record peak on October 9, 2007, rather than starting a bear market, as they did after the market peaked on that day in 2007.
Finally, US stocks are smoking hot compared to most international markets, save Japan. Behold!


